

Which dates erased years of crypto gains and wiped out billions overnight?
From Mt. Gox in 2014 to the Terra collapse and FTX in 2022, crypto’s history is a chain of crashes caused by hacks, bad design, excess leverage, and macro shocks.
This timeline points to the biggest market collapses and shows who felt the pain: exchanges, lenders, hedge funds, and retail.
It explains why those events mattered for trust and liquidity and gives quick signals to watch so you can tell a normal correction from a systemic crisis.
Chronological Overview of Major Cryptocurrency Crash Dates
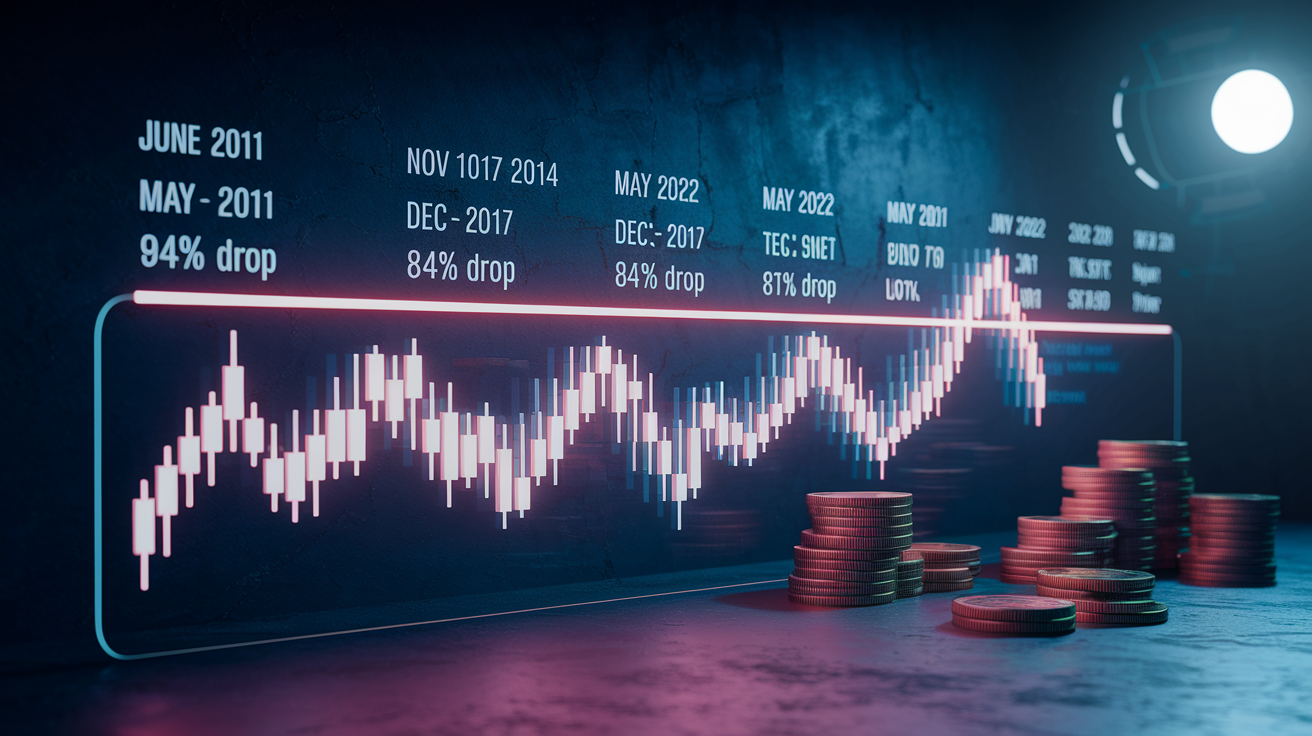
Here are the dates that mark the worst cryptocurrency crashes on record. Each one represents a drawdown over 40% or a systemic failure that spread across the market:
- June 2011 – Bitcoin crashed about 94% from a local peak around $32 down to roughly $2 after an exchange hack and heavy selling.
- November 2013 to early 2014 – Bitcoin peaked near $1,150 in late November 2013. Then Mt. Gox went bankrupt in February 2014, triggering a 65–70% drop.
- December 2017 to December 2018 – Bitcoin fell from $19,783 to around $3,200, an 84% decline that ended the ICO bubble.
- March 12, 2020 (Black Thursday) – Bitcoin dropped roughly 50% in one day, falling to the $3,800–$4,000 range as pandemic panic spread.
- May 19–23, 2021 – Bitcoin declined from about $58,000 to $30,000, a 45–50% drop driven by China’s mining crackdown and Tesla suspending BTC payments.
- May 7–13, 2022 – Terra’s UST stablecoin lost its dollar peg and LUNA collapsed from around $80–$100 to fractions of a cent, erasing tens of billions in market value.
- June–November 2022 – The broader crypto winter saw Bitcoin fall 77% from its November 2021 all-time high of about $69,000 to $15,000–$16,000 by November 2022.
- November 11, 2022 – FTX filed for bankruptcy after a liquidity crisis, triggering immediate market declines of 25–30% and spreading contagion across custodial platforms.
These weren’t just technical corrections. Each represents a moment when something broke: exchange fraud, algorithmic design failures, excessive leverage, macro shocks. They caused widespread forced selling and destroyed market trust. Understanding when cryptocurrency crashed helps you tell the difference between normal volatility (temporary price swings of 10–20%) and true crises that erase years of gains and force fundamental rebuilding.
The timeline shows crashes cluster around certain patterns. Early crashes (2011, 2014) were mostly about exchange security failures and immature infrastructure. Mid-cycle crashes (2017–2018, 2021) followed speculative bubbles fueled by retail FOMO and unregulated token offerings. Recent crashes (2020, 2022) increasingly reflected macro conditions: liquidity shocks, interest rate policy, contagion through interconnected lenders and funds. Knowing the exact dates and contexts makes it easier to spot warning signs before the next downturn.
Recovery times have varied dramatically. The March 2020 crash reversed within nine months as central bank stimulus restored risk appetite. The 2017–2018 crash took roughly three years before Bitcoin surpassed its prior peak in late 2020. The 2022 bear market, compounded by multiple failures, stretched well into 2023 before meaningful recovery started. Each crash’s timeline reflects both the severity of underlying damage and the availability of new capital to rebuild confidence.
Cryptocurrency Crash Patterns Across Major Market Cycles

Cryptocurrency crashes typically follow a recognizable rhythm. Prices surge on hype, whether it’s the 2013 Silk Road boom, the 2017 ICO mania, or the 2021 institutional adoption wave. Then they collapse when liquidity drains or a structural failure exposes vulnerabilities. Leverage amplifies both the rise and the fall. In 2017, Bitcoin margin markets and altcoin speculation drove the climb to nearly $20,000. When sentiment reversed, cascading margin calls and forced liquidations accelerated the decline. The same thing repeated in 2021–2022, except this time leverage was embedded in centralized lenders (Celsius, BlockFi) and hedge funds (Three Arrows Capital) rather than just retail traders.
Regulatory shocks and contagion turn corrections into crashes. China’s 2021 mining ban didn’t just cut hash power. It triggered uncertainty about future enforcement worldwide, causing traders to exit positions. The Terra collapse in May 2022 didn’t stop at one token. It spread to any fund or lender holding UST or LUNA, creating a liquidity crisis that eventually reached FTX by November. Each crash reveals how interconnected the market has become. A single algorithmic stablecoin can wipe out hedge funds, freeze withdrawals at multiple exchanges, and erase hundreds of billions in total market cap within weeks.
The table below compares three major cycles by their drawdown magnitude and primary trigger:
| Cycle | Peak-to-Trough % | Primary Trigger |
|---|---|---|
| 2013–2014 | ~65–70% | Mt. Gox bankruptcy and exchange fraud |
| 2017–2018 | ~84% | ICO bubble collapse and regulatory crackdowns |
| 2021–2022 | ~77% | Macro tightening, Terra/LUNA failure, FTX collapse |
Each cycle’s recovery depended on new narratives and capital inflows, whether from early adopters rebuilding after Mt. Gox, retail chasing altcoins post-2018, or institutions entering via ETFs and corporate treasuries post-2020.
Detailed Timeline of the 2017–2018 Cryptocurrency Crash

Bitcoin reached an all-time high of $19,783 on December 17, 2017, capping a year in which it surged from under $1,000. The rally was driven by an explosion of initial coin offerings. Projects raised about $4.9 billion in 2017 alone. Retail speculation fueled by headlines and social media hype added more pressure. By mid-December, exchanges struggled to handle new account registrations and trading volume. Then the market broke.
From that December peak, Bitcoin fell to roughly $6,000 by early February 2018, recovered briefly to around $11,000 in spring 2018, and then entered a grinding decline through the rest of the year. By December 2018, Bitcoin traded near $3,200, an 84% peak-to-trough drawdown. Most altcoins fared worse. Tokens that had 10x or 50x in 2017 lost more than 90% of their value, and many projects disappeared entirely as teams abandoned roadmaps or were revealed as scams. The crash exposed the ICO model as mostly unregulated securities offerings with little accountability.
Recovery to new all-time highs didn’t occur until late 2020, roughly three years after the 2017 peak. During that time, the market matured. Exchanges improved security and compliance, institutional infrastructure (custody, futures, regulated on-ramps) developed, and speculative fervor cooled. The 2017–2018 crash taught the market that hype-driven rallies without underlying adoption or utility inevitably reverse.
The most significant triggers behind the 2017–2018 crash were:
- Regulatory crackdowns. China banned ICOs and shut down domestic exchanges in late 2017. U.S. SEC enforcement actions increased in 2018.
- ICO token unlocks and founder sell-offs. Many projects dumped large allocations onto the market after raising funds.
- Margin liquidations. Overleveraged long positions unwound in cascading waves as prices fell.
- Loss of retail interest. New account growth at exchanges slowed sharply, reducing buying pressure and liquidity.
Timeline of the 2022 Crypto Winter and Key Market-Wide Contagion

The 2022 crypto winter started not with a single crash but with a slow erosion of market confidence beginning in late 2021. Bitcoin’s all-time high near $69,000 in November 2021 coincided with the Federal Reserve signaling the end of ultra-loose monetary policy. As interest rates rose and liquidity tightened through early 2022, risk assets (including crypto) came under sustained selling pressure. By mid-2022, total cryptocurrency market capitalization had fallen from roughly $3 trillion to below $1 trillion, erasing about $2 trillion in value over six months.
Bitcoin declined roughly 70% from its all-time high, but the broader damage came from contagion across centralized lenders, hedge funds, and exchanges. These institutions had built large, interconnected exposure webs during the 2020–2021 bull run: lending customer deposits, taking leveraged bets, offering unsustainable yield products. When prices fell and margin calls arrived, many couldn’t meet obligations. Celsius paused withdrawals in June 2022, citing “extreme market conditions.” Three Arrows Capital (3AC), a major crypto hedge fund, defaulted on loans and filed for bankruptcy in July 2022 with reported liabilities exceeding $2.8 billion. Voyager Digital, which had lent more than $650 million to 3AC, froze customer accounts and declared bankruptcy shortly after.
The cascading failures weren’t driven by a single technical flaw or hack. Instead, they reflected systemic over-leverage and a lack of transparency about counterparty risk. Platforms had promised high returns by rehypothecating customer assets, lending the same collateral multiple times or using it for proprietary trading. When asset prices fell and withdrawals spiked, liquidity evaporated. BlockFi, another lender, suspended withdrawals and later accepted a bailout (which itself became worthless after FTX’s collapse). The market learned that “crypto banks” offering 8–20% yields weren’t operating with traditional banking safeguards or reserves.
Macro conditions accelerated the downturn. Rising interest rates made risk-free Treasury yields more attractive than speculative crypto bets. Equity markets, especially growth and tech stocks, sold off sharply in 2022, and Bitcoin’s correlation with those assets meant it followed. Institutional participants who’d entered crypto during 2020–2021 reduced exposure or liquidated entirely as portfolio risk management required deleveraging. The combination of forced selling, evaporating liquidity, and broken trust created a multi-month bear market that persisted through the end of 2022 and into 2023.
| Month | Event | Market Impact |
|---|---|---|
| January 2022 | Fed signals rate hikes; risk-asset selloff begins | BTC falls from ~$47k to ~$35k |
| June 2022 | Celsius halts withdrawals; 3AC defaults | BTC drops below $20k; contagion spreads to lenders |
| July 2022 | Voyager and 3AC bankruptcy filings | Market cap remains under $1T; trust in CeFi erodes |
| September 2022 | Ethereum completes Merge; brief rally fades | BTC trades sideways ~$19k–$22k |
| November 2022 | FTX collapse accelerates selling | BTC falls to ~$15k–$16k; widespread panic |
Terra/LUNA Collapse: When the Algorithmic Stablecoin Crash Unfolded

TerraUSD (UST) was an algorithmic stablecoin designed to maintain a $1 peg through a mint-and-burn mechanism with its sister token, LUNA. On May 7, 2022, UST began losing its peg, falling to roughly $0.98, then $0.91 by May 9. Terra Labs deployed about $3.5 billion in Bitcoin reserves to defend the peg by buying UST and providing liquidity, but the defense failed. By May 11, UST traded below $0.30, and LUNA (which had traded near $80–$100 in late April) collapsed to fractions of a cent within days. At its all-time high, LUNA had reached $116. By May 13, it traded at $0.0001, effectively worthless.
The collapse wiped out an estimated $45 billion in direct LUNA holder value within weeks. Industry-wide estimates suggest that contagion and secondary losses tied to the Terra ecosystem exceeded $500 billion when accounting for forced liquidations, devalued DeFi positions, and the knock-on failures of funds and lenders exposed to UST or LUNA. The speed and totality of the collapse shocked the market. Unlike a hack or exchange failure, this was a design flaw, an algorithmic mechanism that spiraled out of control once confidence broke.
How the Depeg Triggered Market-Wide Panic
The mechanics of the Terra crash centered on a reflexive death spiral. When UST fell below $1, arbitrageurs were supposed to burn UST and mint new LUNA, profiting from the price difference while reducing UST supply and restoring the peg. But this mechanism required continuous demand for LUNA. Once UST lost confidence, minting new LUNA flooded the market with supply, causing LUNA’s price to collapse. That collapse further eroded confidence in UST, triggering more redemptions and more LUNA minting. A feedback loop with no floor.
The panic spread through several channels:
- Large holders and funds holding UST (including Three Arrows Capital) faced instant, massive losses and margin calls.
- DeFi protocols built on Terra saw total value locked evaporate overnight, stranding user funds.
- Centralized platforms like Celsius and Voyager, which had offered yield on UST deposits, suddenly held worthless collateral and faced customer withdrawal demands they couldn’t meet.
- The broader stablecoin market came under scrutiny. Tether (USDT) briefly depegged to $0.995 in the days following Terra’s collapse as traders questioned all algorithmic and reserve-backed pegs.
- Bitcoin’s price fell sharply as Terra’s reserve selling added sell pressure and market sentiment turned sharply risk-off.
The Terra collapse demonstrated that algorithmic stablecoins without sufficient collateral or liquidity backstops are vulnerable to bank-run dynamics. Once confidence breaks, no amount of reserve deployment or market intervention can stop a reflexive unwind if the core mechanism depends on continuously rising demand for the paired token.
FTX Collapse Timeline: November 2022 and the Industry Aftershocks

FTX, once the third-largest cryptocurrency exchange by volume, collapsed in early November 2022 after a liquidity crisis and revelations of alleged misuse of customer funds. The crisis began on November 2, 2022, when a leaked balance sheet showed that Alameda Research (a trading firm closely tied to FTX) held large amounts of FTT, FTX’s native exchange token, as collateral. Binance CEO Changpeng Zhao announced on November 6 that Binance would liquidate its FTT holdings, citing “recent revelations.” FTT, which had been trading in the low $20s, fell sharply. Within days, customers rushed to withdraw funds from FTX.
On November 8, FTX paused withdrawals, citing “a backlog.” By November 10, it was clear the exchange didn’t have the assets to meet customer redemption requests. Binance briefly announced a non-binding agreement to acquire FTX on November 9, then backed out within 24 hours after reviewing FTX’s books. FTX filed for bankruptcy on November 11, 2022. FTT collapsed from an all-time high near $85 to $0.87 in the aftermath, and Bitcoin dropped from roughly $21,000 to lows near $15,000–$16,000 as the market absorbed the shock.
The fallout extended far beyond FTX itself. Multiple platforms and lenders disclosed significant exposure to FTX or Alameda. BlockFi, already weakened from earlier 2022 contagion, filed for bankruptcy in late November after a bailout agreement with FTX became worthless. Genesis Global, a major institutional lender, paused withdrawals and later filed for bankruptcy in January 2023. Criminal charges followed. Founder Sam Bankman-Fried was arrested in December 2022 and later convicted on multiple counts of fraud and conspiracy related to the alleged misuse of billions in customer deposits.
| Event | Date | Market Impact |
|---|---|---|
| Binance announces FTT liquidation | November 6, 2022 | FTT falls from ~$22 to ~$15; withdrawal surge begins |
| FTX halts withdrawals | November 8, 2022 | BTC drops ~$20k → ~$17k; panic spreads across exchanges |
| FTX bankruptcy filing | November 11, 2022 | BTC falls to ~$15.5k; total market cap declines tens of billions |
Mt. Gox Collapse: The First Major Cryptocurrency Exchange Crash

Mt. Gox was once the world’s largest Bitcoin exchange, handling roughly 70% of all Bitcoin transactions at its peak. In late 2013, Bitcoin reached an all-time high of $1,127 on the platform. By early 2014, users began reporting withdrawal delays and missing funds. On February 7, 2014, Mt. Gox halted all Bitcoin withdrawals, citing technical issues. On February 24, the exchange went offline entirely. Days later, CEO Mark Karpelès announced that about 850,000 bitcoins (worth roughly $460 million at the time) were missing. The company filed for bankruptcy in Tokyo on February 28, 2014.
The loss represented roughly 6% of all Bitcoin in existence at the time and triggered a multi-year bear market. Bitcoin’s price fell from the November 2013 high to around $360 by early April 2014, a decline of roughly 68%. The collapse shattered confidence in centralized exchanges and raised fundamental questions about custody, security, and regulatory oversight. Later investigations revealed that the missing coins were likely stolen over years through a combination of hacking, internal fraud, and poor operational security. A small portion of the missing bitcoins was eventually recovered, but the majority remain lost.
The key events in the Mt. Gox collapse timeline were:
- November 2013. Bitcoin hits $1,127 on Mt. Gox. Exchange handles majority of global BTC trading volume.
- Early 2014. Users report withdrawal delays. Rumors of insolvency circulate.
- February 7, 2014. Mt. Gox halts all Bitcoin withdrawals, citing unspecified technical problems.
- February 24, 2014. Exchange goes offline. CEO resigns from Bitcoin Foundation board.
- February 28, 2014. Mt. Gox files for bankruptcy in Japan, disclosing loss of roughly 850,000 BTC (later reduced to ~740,000 after some recovery).
Black Thursday (March 2020): The Pandemic-Driven Crypto Crash

On March 12, 2020, Bitcoin fell roughly 50% in a single day, dropping from around $7,900 in the morning to a low near $3,800 by the evening (UTC). The crash was part of a global market panic as COVID-19 lockdowns spread and investors liquidated all risk assets to raise cash. Equity markets saw circuit breakers triggered, oil prices collapsed, and even gold sold off temporarily as traders scrambled for liquidity. Crypto wasn’t immune. In fact, it amplified the move.
The crash triggered more than $10 billion in forced liquidations across Bitcoin and altcoin futures and margin markets. Exchanges like BitMEX saw their systems overloaded by the volume of liquidation orders, and some platforms experienced outages that prevented traders from closing positions or adding collateral. Ethereum fell even harder than Bitcoin, briefly touching $90 after trading above $200 just days earlier. The rapid drawdown exposed how much leverage had built up in the market during the prior months and how quickly liquidity could vanish during a macro shock.
Recovery came faster than in prior crashes. Central banks around the world, led by the U.S. Federal Reserve, launched unprecedented stimulus programs: cutting rates to zero, buying trillions in bonds, flooding the financial system with liquidity. Risk appetite returned within weeks. By late 2020, Bitcoin had not only recovered the March losses but surged to new all-time highs near $30,000, driven by institutional interest and the narrative that crypto could hedge against inflation and currency debasement. The nine-month recovery from March 2020 to December 2020 remains one of the fastest in crypto history.
Understanding Why Cryptocurrency Crashes Happen

Cryptocurrency crashes are caused by a mix of structural vulnerabilities and external shocks. Hacks and exchange failures (like Mt. Gox in 2014 or FTX in 2022) expose the risks of centralized custody and weak operational controls. When an exchange holds billions in customer assets without adequate reserves or internal safeguards, a liquidity crisis or fraud can wipe out funds overnight. These events destroy trust and trigger withdrawal runs across the broader market as users rush to move assets off platforms.
Speculative bubbles and leverage wipeouts are another recurring cause. The 2017 ICO boom and the 2021 bull run both saw massive retail inflows chasing returns, often financed by margin or loans. When prices reverse, cascading margin calls force automated selling, which accelerates the decline and triggers more liquidations. A feedback loop that can erase months of gains in days. Single-day liquidation events have exceeded $10 billion multiple times, each one amplifying volatility and panic.
Algorithmic stablecoin failures and systemic contagion add a third layer of risk. Terra’s UST collapse in May 2022 showed how a flawed mechanism can spiral out of control once confidence breaks, spreading losses to any fund, lender, or DeFi protocol holding the asset. Because crypto markets are highly interconnected (funds lend to exchanges, exchanges lend to other funds, and everyone holds some of the same collateral), one failure can cascade through the system. Three Arrows Capital’s default triggered bankruptcies at Voyager and BlockFi. FTX’s collapse froze withdrawals at Genesis and multiple smaller platforms.
Specific causes that have triggered major crashes include:
- Exchange hacks or insolvency (Mt. Gox, FTX, Bitfinex)
- Algorithmic stablecoin design failures (Terra/LUNA)
- Regulatory crackdowns or bans (China mining ban, SEC enforcement actions)
- Macro liquidity shocks (March 2020 pandemic panic, 2022 Fed rate hikes)
- Ponzi schemes and fraud (Bitconnect, OneCoin)
- Overleveraged positions and forced liquidations (2017–2018, May 2021, 2022)
Recovery Timelines After Cryptocurrency Crashes
Recovery timelines vary widely depending on the cause and severity of the crash. The March 2020 “Black Thursday” crash saw Bitcoin fall 50% in one day, but the market fully recovered within nine months. The rapid rebound was driven by unprecedented central bank stimulus, low interest rates, and a narrative shift toward crypto as a hedge against inflation. By December 2020, Bitcoin had reached new all-time highs near $30,000, erasing the March losses and continuing higher into 2021.
The 2017–2018 crash required roughly three years for Bitcoin to surpass its prior peak. After reaching $19,783 in December 2017, Bitcoin fell 84% to around $3,200 by December 2018. The market remained depressed through 2019 and early 2020, with intermittent rallies that failed to break the prior high. Only in late 2020 (nearly three years after the peak) did Bitcoin reclaim and exceed $20,000. The long recovery reflected the need to rebuild trust after the ICO bubble, develop institutional infrastructure, and wait for a new wave of capital and narratives to enter the market.
| Crash Event | Trough Date | Time to Recovery (new ATH) |
|---|---|---|
| 2017–2018 crash | December 2018 (~$3,200) | ~3 years (late 2020) |
| March 2020 Black Thursday | March 12, 2020 (~$3,800) | ~9 months (December 2020) |
| 2021–2022 bear / FTX crash | November 2022 (~$15,500) | Extended into 2023; partial recovery by mid-2023 |
Warning Signs Before a Cryptocurrency Market Crash
Certain patterns and metrics tend to appear before major cryptocurrency crashes. Extreme leverage buildup is one of the clearest signals. When open interest in Bitcoin futures or total loans on lending platforms spike to new highs, it indicates that much of the recent price rise is financed by borrowed capital. Once prices reverse even slightly, margin calls and forced liquidations can cascade, accelerating the decline. Monitoring futures open interest, funding rates (the cost of holding leveraged positions), and total value locked in lending protocols can provide early warnings.
Sentiment indicators also flash red before crashes. When social media mentions, Google search trends, and new exchange account registrations surge to extremes, it often marks the final wave of retail buying before exhaustion. Similarly, extremely high funding rates (indicating aggressive long positions) or negative exchange net flows (more coins moving onto exchanges, suggesting preparation to sell) can precede sharp reversals. Parabolic price moves that decouple from any fundamental driver (such as Bitcoin rising 50% in a month with no major adoption news) are classic bubble signals.
Specific warning signs that have preceded past crashes include:
- Rapid increase in futures open interest combined with rising funding rates (indicating overleveraged longs)
- Stablecoin reserve transparency issues or large, unexplained outflows from major stablecoins
- Regulatory announcements or leaked enforcement actions targeting major exchanges or tokens
- Macro liquidity tightening (central banks raising rates, reducing bond purchases)
- Hash rate drops or miner capitulation (large-scale mining shutdowns, often due to unprofitability or regulatory pressure)
Final Words
We ran the timeline of major crashes — June 2011, 2013–14, 2017–18, March 2020, May 2021, the 2022 multi‑event cycle, Mt. Gox and Black Thursday — and showed patterns, causes, and recovery timelines.
If you’re asking when did cryptocurrency crash, the short answer is: several times, and each episode reinforces the same lessons about leverage, stablecoin risks, contagion, and regulatory shocks. Watch the warning signs, limit exposure, and plan for slow recoveries. Markets recover; being prepared helps.
FAQ
Q: When did the crypto crash happen?
A: The crypto crash happened at several key moments: June 2011, 2013–2014, 2017–2018, March 2020 (Black Thursday), May 2021, the multi-event 2022 cycle (including Terra and FTX), and Mt. Gox in 2014.
Q: What if I invested $10,000 in Bitcoin 5 years ago?
A: If you invested $10,000 in Bitcoin five years ago (around March 2021), you’d own roughly 0.18 BTC; multiply that amount by today’s Bitcoin price to find your current value.
Q: What if I invested $20 in Bitcoin in 2009?
A: If you invested $20 in Bitcoin in 2009, you’d likely own thousands of BTC (depending on mining or early buys), now worth many millions at current prices—multiply your BTC holdings by today’s price.
Q: What is the largest crash in crypto history?
A: The largest crash by percentage was 2017–2018, when Bitcoin fell about 84%; the biggest market-cap loss occurred in 2022, which scrubbed roughly $2 trillion from the market during a multi-event downturn.
