What if your app went offline for 15 hours and the status page was slow or missing, would your team survive?
Heroku’s recent platform outages—including a 15-hour network failure on June 10 and regional degradations in July—knocked dashboards, the CLI, scaling, and many apps offline while delaying official updates.
This post gives a real-time status and resolution update: who’s affected, why it matters to deployments and costs, likely causes, and exact steps to check, mitigate, and recover so you can act fast.
Real-Time Heroku Platform Status Overview

Heroku’s official status page is where you’ll find live operational data for every major piece of the platform. It refreshes automatically and shows green, yellow, or red indicators next to short incident descriptions and timestamps. When something breaks, engineers post updates to the timeline, usually within minutes.
You’ll see three main categories: runtime services that run your app code, data infrastructure handling databases and caching, and control-plane services like the dashboard and API endpoints. Most developers hit the status page first when weird stuff happens, since it bundles incident scope, affected regions, and estimated fix times in one place. But when things go really sideways, the status page itself can slow down or disappear if the control plane is also struggling.
Status updates include start time, which subsystems got hit, progress notes, and resolution confirmations. Heroku won’t automatically alert everyone. You need to subscribe through email, SMS, or webhook integrations if you want real-time pings when outages touch your stack. The page also keeps past incidents on file, so you can match strange app behavior to specific platform events later.
Major service categories you’ll see tracked:
- Runtime (Dynos) – Running web, worker, and one-off processes across Common and Private runtime environments.
- Data Services – Postgres, Redis, and other managed add-ons, plus replication, backups, and connection pooling.
- Login and Authentication – OAuth flows, API token issuance, and dashboard session management.
- Dashboard and CLI – Web console availability and command-line tool responsiveness for deploys and config changes.
- Platform API – Programmatic access to app creation, scaling, releases, and log retrieval.
Summary of Recent Platform Incidents

Between June and July 2025, Heroku logged three big service events that degraded or killed core functionality for hours. On June 10, an automated infrastructure update broke network connectivity across the platform. The dashboard became inaccessible and CLI operations stopped working for 15 hours and 45 minutes. Lots of deployed apps went dark during that window. The status page itself was affected, which delayed public communication.
Eight days later, on June 18, dyno formation and autoscaling systems hit errors that caused degraded compute behavior for 8 hours and 30 minutes. Apps couldn’t scale correctly and triggered unexpected restarts.
July brought two problems at once on the 16th: the data.heroku.com dashboard stayed down for 3 hours and 35 minutes while the Common Runtime in the EU region suffered performance issues during the same stretch. Both events messed up developer workflows. Teams couldn’t view metrics, modify database settings, or deploy reliably in affected regions. Heroku’s incident postmortems blamed internal orchestration errors and regional infrastructure strain, but detailed root-cause analysis wasn’t published for every event.
A pattern showed up throughout 2024 and into mid-2025: intermittent authentication failures, platform API slowdowns, logging delivery gaps, and SSL provisioning delays. These smaller incidents rarely lasted more than an hour individually, but their frequency wore down confidence and forced engineering teams to build workarounds like retry logic, health-check redundancy, and multi-region failover strategies.
Historical Reliability Patterns

Heroku used to keep uptime really high across core services, often clearing 99.5 percent annually for runtime and data components. But periodic multi-hour disruptions have broken up that record, usually tied to upstream cloud provider incidents or internal control-plane updates. In 2022, a serious OAuth token breach exposed GitHub credentials and private repository data, followed by criticism of slow and unclear platform communication. That same year, Heroku removed all free dynos and hobby databases, shifting the entire user base to paid tiers and increasing cost pressure just as reliability concerns grew.
Between 2023 and 2025, the platform had fewer catastrophic outages but a higher cadence of smaller degradations hitting regional runtimes, logging pipelines, and dashboard services. Engineers started noticing that critical modern features—HTTP/2 support, updated buildpacks, and advanced autoscaling—arrived years behind industry adoption curves. This stagnation, combined with recurring incidents, pushed many teams to evaluate alternatives with stronger uptime records, transparent incident disclosure, and more predictable pricing.
| Year | Major Events | Estimated Service Impact |
|---|---|---|
| 2022 | OAuth token breach; removal of free tier | Security exposure; developer onboarding halted |
| 2024 | Recurring authentication and logging failures | Intermittent CLI/API access issues; log gaps |
| 2025 | 15-hour outage (June 10); regional EU degradation (July 16) | Apps offline; dashboard inaccessible; scaling failures |
Common Causes of Service Interruptions
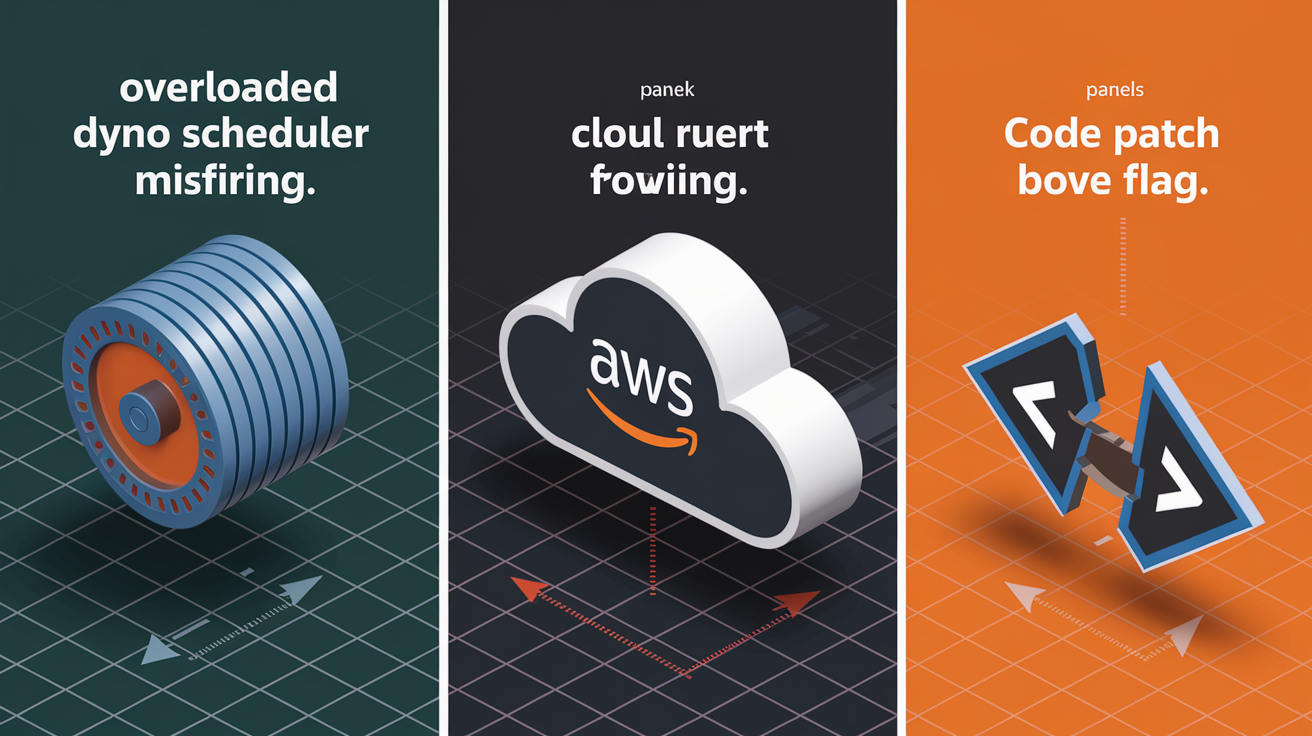
Internal dyno scheduler problems are one of the most frequent sources of platform instability. The scheduler manages process placement, restart policies, and horizontal scaling across thousands of customer applications. When orchestration logic fails or hits unexpected state, dynos can restart without warning, refuse to boot, or ignore scale commands. These failures usually show up as sudden traffic drops, HTTP 503 errors, or missing worker processes, and they typically need manual intervention from Heroku’s ops team to fix.
External dependencies on AWS infrastructure add another layer of risk. Heroku runs on top of Amazon Web Services in multiple regions, so any EC2 instance degradation, EBS volume slowdown, or Route 53 DNS hiccup can cascade into visible app impact. While AWS keeps overall reliability strong, regional issues do happen, and Heroku’s control plane sometimes doesn’t have the isolation needed to ride out those events transparently. Database replication delays and connection pool exhaustion also appear during high-traffic periods or when add-on providers hit their own scaling bottlenecks.
Code-level rollout errors occasionally degrade service when Heroku deploys updates to its own platform components. An improperly staged configuration change, a busted feature flag, or a broken health check can spread across the fleet, taking down dashboards, logging endpoints, or API gateways. The June 10, 2025 incident was triggered by an automated update that disrupted network connectivity. When the update process itself is broken, recovery can take many hours because engineers have to identify the bad change, roll it back safely, and verify that routes and services return to normal without causing secondary failures.
Steps to Diagnose Problems With Your Heroku App

When your app becomes unresponsive or behaves weird, start by figuring out whether the issue lives in your code, your infrastructure config, or the Heroku platform itself.
- Check application logs immediately – Run
heroku logs --tail --app your-app-nameto stream real-time output and look for uncaught exceptions, segmentation faults, out-of-memory errors, or failing health checks. - Confirm recent dyno restarts – Use
heroku ps --app your-app-nameto inspect dyno state and uptime. Unexpected restarts often point to crashloops, memory limits, or platform scheduler issues. - Review the latest deploy – Run
heroku releases --app your-app-nameand compare timestamps. If the problem started right after a deployment, roll back withheroku rollbackand re-test. - Validate add-on connectivity – Check each attached service (Postgres, Redis, etc.) via
heroku addons --app your-app-nameand review add-on dashboards for connection pool saturation, replication lag, or maintenance windows. - Verify DNS resolution and external access – Use
dig your-app-name.herokuapp.comto confirm DNS records point to Heroku’s routing layer. Check for certificate errors or CDN misconfigurations if you’re using a custom domain. - Inspect recent configuration changes – Run
heroku config --app your-app-nameand compare against previous known-good states. Incorrect environment variables, missing secrets, or changed connection strings break apps all the time after config updates.
If logs show no application-level errors and all add-ons report healthy, cross-reference the Heroku status page and external monitors like StatusGator to see if a platform-wide or regional incident is in progress. During widespread outages, your troubleshooting efforts should shift to monitoring official updates and preparing rollback or failover plans rather than repeatedly restarting dynos or redeploying code.
Official Heroku Resources for Status and Support
Heroku puts platform status information at status.heroku.com, where real-time component health, incident timelines, and subscription options are available without login. This page is the most authoritative source during outages, though it can slow down or become unreachable if the control plane itself is degraded. For deeper technical guidance, Heroku’s developer documentation (devcenter.heroku.com) covers dyno behavior, add-on integration, buildpack usage, and CLI commands.
When app-level troubleshooting and status checks don’t resolve an issue, developers can open support tickets through the Heroku dashboard under the “Support” tab or by emailing support directly. Paid plan tiers get faster response times and access to incident escalation channels. The CLI also has lightweight health commands like heroku status for a quick terminal-based overview of platform availability.
Official resources include:
- Status Portal – Live operational data and incident history at status.heroku.com with email/SMS/webhook subscription options.
- Developer Documentation – Guides, API references, and troubleshooting articles at devcenter.heroku.com.
- CLI Health Commands – Run
heroku statusin your terminal for an instant platform health summary. - Support Ticket Submission – Access the support center through the Heroku dashboard or via help.heroku.com for direct engineering assistance.
Final Words
In the action, we walked through Heroku’s live status page, recent platform incidents, and long-term reliability patterns so you can see what’s down and why.
We covered common causes—dyno, cloud provider, and deployment issues—and gave a clear troubleshooting flow plus official Heroku resources to follow.
If you spot a heroku platform outage, check the status page, review logs and deploy history, and contact support if needed. These steps help limit downtime and get apps back to normal quickly.
FAQ
Q: Are Heroku servers down? Is Heroku still active?
A: Heroku servers may be down during incidents, but Heroku remains an active platform. Check Heroku’s official status page for live, component-level updates, timestamps, and reported outages before assuming a full outage.
Q: Does Amazon own Heroku? Who bought Heroku?
A: Salesforce bought Heroku in 2010; Amazon does not own it. Heroku has operated under Salesforce since that acquisition — check company statements for any future ownership changes.